
Oil sands
Type of resources
Topics
Keywords
Contact for the resource
Provided by
Years
Formats
Representation types
Update frequencies
status
-
Wild fish community data (species, abundance, diversity, length, weight) for 2013 and 2019 are now available for tributaries of the Athabasca River (rivers Steepbank, Ells, Firebag, High Hills, Dunkirk, Horse, Muskeg, Tar and Calumet) and 2017 data for rivers and creeks adjacent to Christina Lake (Christina River, Sunday Creek, Birch Creek, Sawbones Creek, Jackfish Creek and Unnamed Creek). The composition and diversity of the fish communities in these waterbodies have been evaluated over time to identify changes in the presence and abundance of fish species in these waterbodies adjacent to SAGD oil sands mining activity and at sites that are outside of the Athabasca Oil Sands deposit and not influenced by mining activities. Not all waterbodies are adjacent to mining activities and these provide some information as to the natural variability and stability of these fish communities over time. This involved establishing baseline conditions in fish communities in the fall of 2013, 2017 and 2019. This baseline data has assisted in tracking changes in fish communities of these waterbodies over time. Fish community assessments (non-lethal sampling) were carried out in a reach of river using a Smith-Root 12B backpack, Smith-Root LR-24 backpack and or seine at the sites identified in Section 2.3. Length, weight, species identification, and external assessment were performed on fish collected. Fish were then returned to the water at the site of capture. This fish community assessment work commenced September 17th to 27th, 2013, October 3rd to 8th, 2017 and September 24th to October 2nd, 2019. This monitoring activity compliments and supports the Wild Fish Health program.
-
The river bed sediments in the Lower Athabasca are known to shift and migrate downstream. Numerical modelling of water quantity and quality (including sediments) requires accurate river channel cross-sectional geometry within the area of study. Such cross-sectional geometry prior to 2012 was limited for the Lower Athabasca River restricting modelling accuracy and efficiency. As such, in order to better understand the bed sediment dynamics of the lower Athabasca River and to support model development (e.g., calibration/validation of sediment/bitumen erosion/transport/deposition), high resolution swath bathymetry data were collected form bank to bank during open water seasons (2012-2014) covering approximately 115 km from Fort McMurray to the mouth of the Firebag River. Data are presented in 2km stretches of the river and are represented by 1) a kmz file which gives a visual representation of the coverage of the file, and 2) a detailed grid file which contains the full x,y,z coordinates at 0.5m resolution. While very useful for modelling, it should be realized that given the continually changing form of the lower Athabasca bed geometry, the data provided is a “snap shot in time” and is not reflective of the current condition. Further, and as related, this information is not for navigation purposes.
-
Wild fish health data (length, weight, gonad size, etc.) are now available for trout perch collected from the Athabasca and Peace Rivers; white sucker collected from the Athabasca River; longnose sucker collected from the Peace River; slimy sculpin collected from the Steepbank River; lake chub from Alice Creek, the Ells and Dover Rivers; and longnose dace from the Mackay River. Contaminants data available for walleye collected from the Athabasca and Peace Rivers. For each of these data sets, upstream reference areas are provided for comparison to downstream developed sites. Reference data are currently being evaluated for variability between years to develop triggers, and these triggers are essential to eventually quantify potential effects at exposed sites. Using existing critical effect sizes developed in the Environmental Effects Monitoring programs for pulp and paper and metal mining effluents, condition endpoints in white sucker were increased within the deposit. Slimy sculpin condition and reproductive endpoints are also exceeding effect sizes downstream of development sites. This data is now being used to predict future fish health endpoints within sites, between sites and relative to reference variability to help assess change in fish health.
-
Environment and Climate Change Canada’s cause-effect monitoring is focused on understanding how boreal songbirds, including several Species at Risk, are affected by human activity in the oil sands area, particularly the impact of the physical disturbance of forested habitats from exploration, development and construction of oil sands. Determining the abundance of songbird species associated with various habitat type(s) and understanding how the type and number of birds varies with type and amount of habitat, are important components of assessing the effect of habitat disturbance. Regional-scale monitoring focuses on understanding how and why boreal songbirds, including several Species at Risk, are affected by human activity across the Peace, Athabasca and Cold Lake oil sands area. Local-scale projects focus on addressing gaps in our understanding of complex response patterns at regional scales by targeting specific habitats or development features of interest. These data contribute to: a. improving the design of monitoring programs; b. explaining observed trends in populations (why bird populations are increasing or decreasing); c. predicting population sizes within the oil sands area; and d. assessing the individual, additive and cumulative effects of oil sands and other resource development on boreal birds. Data are used by ECCC and our partners to develop new models and increase the robustness of existing models of bird responses to habitat and disturbance. Because models can be used to predict outcomes of future land management scenarios, these models can assist decision-making by helping evaluate land-use choices before impacts are directly observed.
-
Water level and discharge data are available from Water Survey of Canada’s Hydrometric Network. The Water Survey of Canada (WSC) is the national authority responsible for the collection, interpretation and dissemination of standardized water resource data and information in Canada. In partnership with the provinces, territories and other agencies, WSC operates over 2500 active hydrometric gauges across the country, maintains an archive of historical information for over 7600 stations and provides access to near real-time (water level and stream flow) provisional data at over 1700 locations in Canada.
-
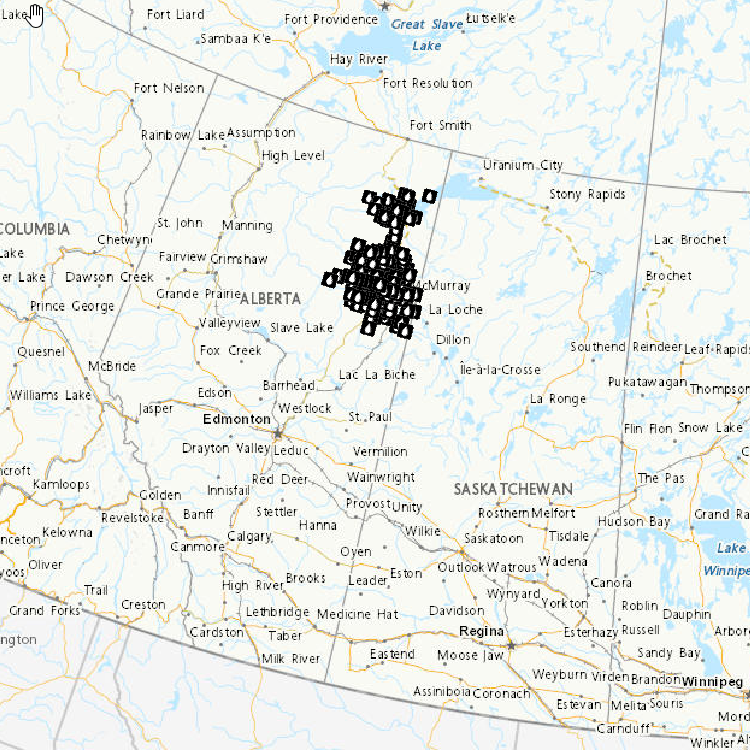
Oil Sands Sediment Exposures of Embryo-larval Fathead Minnows Dataset contains laboratory-studied fathead minnow egg and larval survival rates when exposed to sediments collected from 18 sites in the Athabasca watershed (2010-2014). A controlled laboratory study examined the impacts on fathead minnow eggs and larval development when exposed to collected sediments at concentrations of 1, 5 and/or 25 g/L. Sediments and water were renewed daily, and eggs were assessed as they hatched (in about 5 days), and as the larval fish grew to 8-9 days post hatch (dph), and 15-16 dph. The data in the file present the mean survival (and standard deviation). Two sediment sites caused decreased survival of fathead minnow fry: The Ells River lower site, and the Steepbank River Lower site. These data show that sediment from these sites can affect larval fish survival in the lab. The next steps are to compare these findings to the health data from wild fish collected from these same tributary sites. Toxicity Testing of Groundwater near the Oil Sands Development Dataset contains toxicity studies of groundwaters collected near the Athabasca and Ells rivers. Groundwaters were collected in the summer of 2013 from 4 sites below the riverbeds at depths of 0.5 to 1 metre. Sites were chosen to represent groundwaters close to oil sands tailings ponds and further from tailings ponds and mining activities. Under controlled laboratory conditions, fathead minnow eggs were exposed for 5 days (until hatch) to the groundwaters at standard dilution concentrations of 6, 12, 25, 50, and 100% of the groundwater sample to compare egg and larval fish survival. The data presents the average survival until hatch of 3 repeated exposures (and standard deviation) and 9 repeated exposures for controls. Some groundwater is toxic to minnows and some is not. No correlations were found between toxicity and proximity to a tailings pond. Assessing Toxicity of Oil Sands Related Substances Laboratory fish were exposed to melted snow from sites located close to oil sands mining and upgrading facilities and from sites far away from mining activities to assess the toxicity of substances found in the snow. In addition, river waters, bed sediments, suspended sediments, groundwater and atmospheric depositional samples (pre-melt snow collections) were also tested for toxicity. Fish exposed to undiluted snowmelt showed biological effects. Fish exposed to river water from the region collected during snowmelt conditions showed no effects.
-
Waterfowl and mammals harvested and trapped at various locations in the oil sands region and in reference locations are assessed for contaminant burdens and toxicology. Wildlife samples are obtained from local hunters and trappers. Tissue samples are analysed for concentrations of oil sands-related contaminants (heavy metals, polycyclic aromatic hydrocarbons, and naphthenic acids). Dead and moribund birds collected from tailing ponds are also evaluated for levels and effects of contaminants.
-
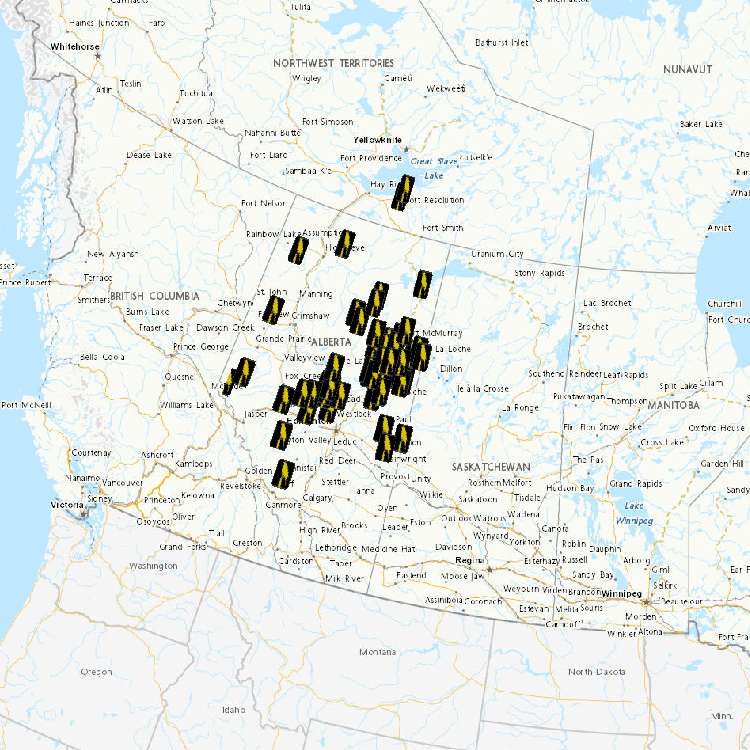
During August 2013, September 2013, April 2018, May 2018, and June 2018, a research aircraft was deployed in the oil sands region. The flight paths of the aircraft were designed to measure air pollutants in plumes around the immediate vicinity of the major oil sands surface mining facilities (2013 & 2018) and in-situ mining facilities (2018 only), and downwind of these sources, at various heights above the ground. These flight paths enabled measurements of how concentrations of air pollutants change with elevation in the atmosphere as well as with distance from pollution sources. The aircraft was equipped with a comprehensive suite of instruments to measure gases, particles and meteorological conditions. It is not appropriate to directly compare these short-term data, measured by aircraft at various altitudes above the surface, with ambient air quality objectives for ground-level concentrations. The measurements were made to characterize and improve understanding of the chemical and physical processes that the oil sands pollutants undergo in the atmosphere. The measurements provide information to estimate the quantity and types of pollutants emitted from oil sands operations, to map out how far the pollutants are transported, and to understand how fast they are chemically converted to new forms of pollutants in the atmosphere. This information will be integrated into a comprehensive air quality model that will be used to predict current and future air pollutant levels and surface deposition amounts near to the oil sands and also far downwind. These environmental predictions help identify locations that may experience harmful effects today and/or in the future as the oil sands development expands and multiple pollutants accumulate in the environment. To use these data, they must be linked to the latitude, longitude and altitude information provided in the Flight State Parameters for the Airborne Measurements in the Oil Sands Region – 2013 and 2018 data sets. Flight State Parameters for the Airborne Measurements in the Oil Sands Region – 2013 and 2018 A number of different samples of atmospheric chemistry were collected in 2013 and 2018, along 52 flight paths, over parts of the oil sands region. This link provides the location and atmospheric conditions at the aircraft at the time of sample collection at 1-second time resolution. Combining the location and atmospheric conditions information with chemistry data (below) will help to document the transformation, transport and fate of substances emitted from oil sands development activities. Condensation Particle Number Concentration for the Airborne Measurements in the Oil Sands Region – 2013 and 2018 Particle number concentration measurements are organized by the time of sample collection so that they can be combined with Flight State Parameters for the Airborne Measurements in the Oil Sands Region – 2013 and 2018. The particle number concentration is the number of particles up to 2.5 µm in diameter in a volume of air. There are no environmental guidelines for this parameter. Particle number concentration data can be used with other datasets posted on the portal to quantify the emission, transformation, transport and deposition of substances emitted from oil sands activities. Volatile Organic Compounds from the Airborne Measurements in the Oil Sands Region – 2013 and 2018 Approximately 800 canisters were used to sample the airstream outside of the aircraft for ~20 seconds each (approximately 2 km in distance) during 22 flights flown between August 13 and September 7, 2013. Similarly, an additional 800 canisters were used during 30 flights flown between April 5th, and July 5th, 2018. Each canister sample was analyzed to determine the concentration of 100-154 different volatile organic compounds (VOCs). Many of these organic chemicals are important precursors to formation of ozone and secondary particulate matter. This VOC dataset can be used with other datasets posted on the portal to quantify the emission, transformation, transport and deposition of substances emitted from oil sands activities. The VOC data are organized by the time of sample collection so that they can be combined with the Flight State Parameters for the Airborne Measurements in the Oil Sands Region – 2013 and 2018.
-
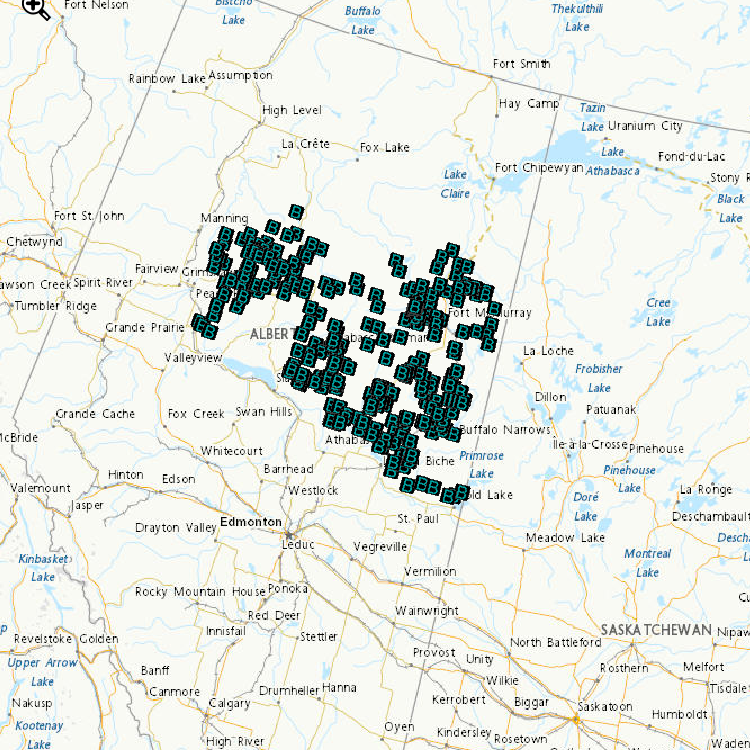
Water Quality Monitoring on Tributaries in the Athabasca River Oil Sands Region Ells River (EL1, ELLS RIFF 2, ELLS RIFF5 [2012-2015]) Mackay River (MA1 [2012-2015], MA2 [2013-2015]) Steepbank River (STB RIFF1, STB WSC, STB RIFF7, STB RIFF10 [2012-2015]) Firebag River (FI1, FI WSC [2012-2015]) Muskeg River (MU1 [2012-2015]), MU6 [2012-2015]), MU7 [2012]) High Hills River (HIHI1 [2013-2015]) Water quality of tributaries in the Athabasca River oil sands region is heavily influenced by the presence of the underlying Cretaceous bedrock, which is comprised of shale, sandstone and limestone. The waters are moderately hard (average alkalinity of 114 mg l-1 CaCO3) because of their mineral content, particularly magnesium (average 8.62 mg l-1), calcium (average 28.06 mg l-1) and bicarbonate (138.53 mg l-1). This mineral content results in an average conductivity of 245 +/- 4 µS cm-1 and total dissolved solids concentration of 140 +/- 2 ppm. Concentrations of nitrogen and phosphorus (indicators of nutrient status) are typically low to moderate, averaging 0.14 mg l-1 total phosphorus, 0.03 mg l-1 total dissolved phosphorus, 0.92 mg l-1 total nitrogen, 0.09 mg l-1 nitrogen as nitrate+nitrite, and 0.04 mg l-1 nitrogen as total ammonia. Seasonal variation for the majority of water quality constituents within the Athabasca tributaries can be strong and is highly reflective of hydrological discharge (i.e., highest concentrations typically occur during snowmelt periods, especially for parameters that are bound to particulate matter). Spatial variation of parameters within tributaries general showed an increasing trend from upstream of development to samples collected downstream of development (near mouth of a tributary). Of the 45 water quality constituents (physical characteristics, major ions, metals, metalloids, selenium) and 52 Polycyclic Aromatic Compounds (PACs) analyzed, 28 have Guidelines for the Protection of Aquatic Life (Canadian Council of Ministers of the Environment – CCME). Only a few parameters were classified with frequent exceedances (i.e., >10% of of the approximately 1430 samples): total iron, 99% of all samples; total aluminum, 61%; total suspended solids, 39%; and total copper, 17%. All measurements of total mercury were below the CCME guideline; only pyrene from the PACs showed occasional exceedances (2% of samples) for established guidelines. Exceedances of guidelines are not uncommon in many river systems within and outside of the Oil Sands region and, in general, are associated with high flow events when suspended solids and contaminant loads are the greatest. High concentrations of suspended sediment (measured as total suspended solids) were observed during high flow events, such as occur during snowmelt and summer rainfall events. The high percentage of exceedances for iron was expected as these waters are known to have naturally-occurring high concentrations of iron. Mercury in Tributaries This data set includes river water concentrations of total mercury (THg; all forms of mercury in a sample) and methyl mercury (MeHg; the form of mercury that bioaccumulates through food webs) in five Athabasca River tributaries (Ells, Steepbank, Firebag, Muskeg and MacKay rivers). No samples exceeded the Canadian Council of Ministers of the Environment guidelines for THg and MeHg.
-
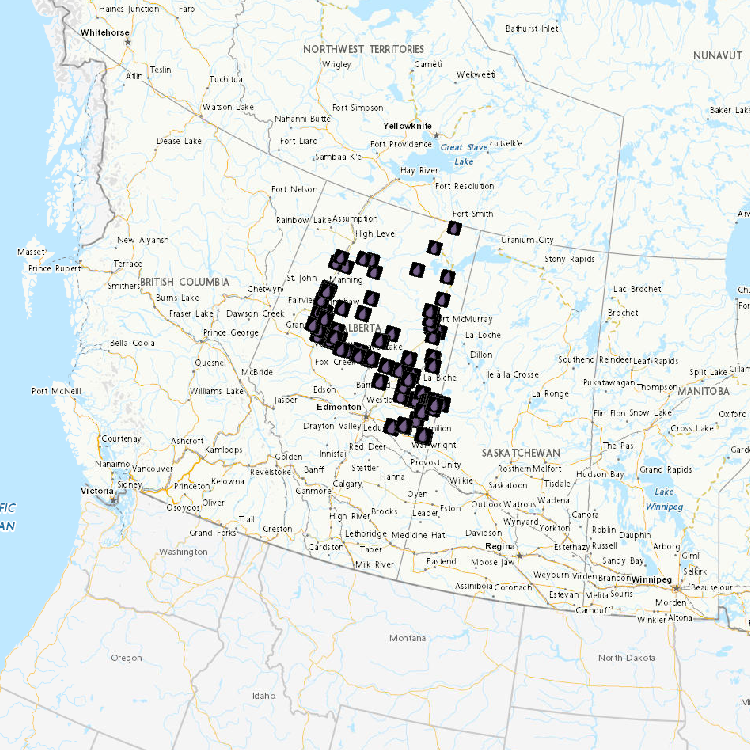
Atmospheric Contaminant Deposition using Snowpack The data set includes snow samples (metals, water chemistry and polycyclic aromatic hydrocarbons [PAHs]). Data from 2012-2014 snowpack samples collected from ~90-130 sites located varying distances from the major oil sands development area show deposition patterns and levels consistent with earlier studies carried out in 2008 (Kelly et al. PNAS, 2009 and 2010). As with earlier findings, concentrations of numerous metals, water chemistry parameters (Ni, Pb, Zn, V, La, Al, Fe, total Hg, methyl Hg, total suspended solids [TSS], particulate organic carbon [POC], particulate organic nitrogen [PON], total phosphorus [TP]) and PAHs decrease with distance from the major mining extraction and upgrading facilities. Canadian Council of Ministers of the Environment (CCME) guidelines do not exist for snow.